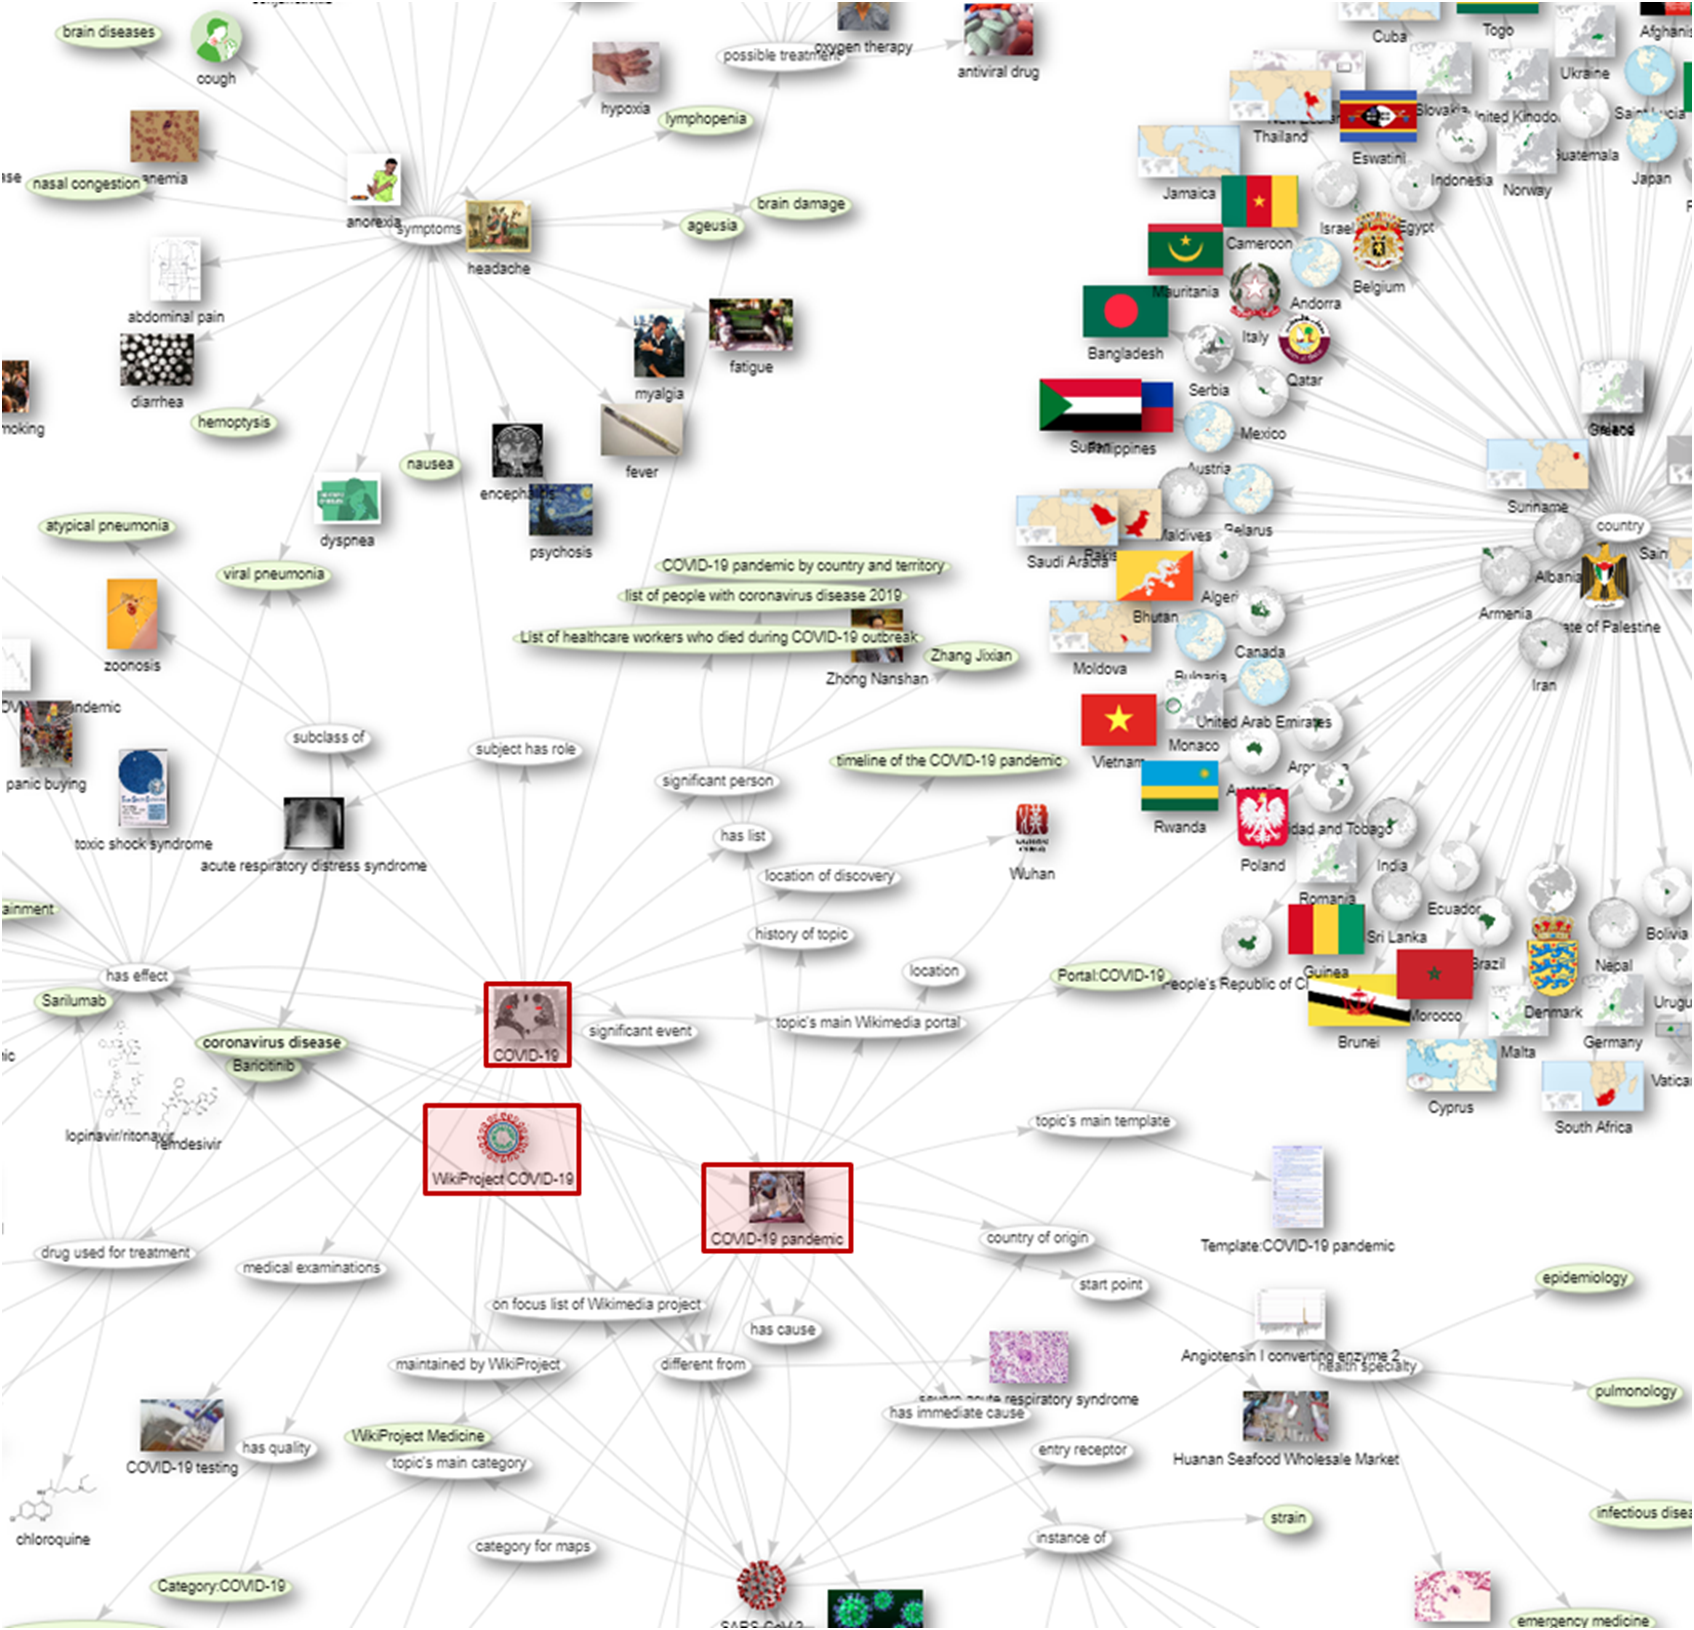
“COVID-19 graph of Wikidata” by Csisc, CC BY 4.0
What is a Content Graph?
A Content Graph is essentially a Knowledge Graph (KG) with content attached, or a content-centric KG.
So if a KG is a network of concepts and their relationships, a Content Graph is expanded to include content related to those concepts (and other metadata from the content, like authors).
Google provides a well-known example of how KGs are used for information discovery:

In this example, the search for “optics” provides two kinds of results: on the left, the familiar list of links to, and short descriptions of, websites that correspond to my search. (Or, at least, links that are often clicked on when that search is performed; but that’s another story.) On the right, we see the “knowledge card” featuring more information about the subject of my search: links to Wikipedia, related photos, and various other bits depending on the subject. In this way, the subject of the search is treated as a concept connected to content related to that concept.
Does this look like your search?
What would it take to get there?
Everyone Has Huge Piles of Content, but Nobody Can Find Anything
Let’s imagine that you’re a publisher of, say, scholarly journal articles. (For this exercise, let’s assume we mean that publishing is your main business; as all organizations produce tons of content we’re all publishers at this point to some extent.) Your revenue is generated by charging for access to your “database” of content, which is really just your content with a search application exposed on a website. You have many hundreds of thousands of articles…and your search is bad. That is to say: the major endpoint for which you charge access to content as your business model is poor. Not only does it fail the concept-plus-content experience, it fails to provide a good search experience.
(The same scenario basically holds for any enterprise’s intranet, or internal content search—except instead of your paying customers it’s your employees who have a bad experience finding stuff (which also wastes time). For retailers, the main content is products and perhaps content about products, in which case a good search is also critical; in any of these scenarios the same principles apply.)
This is due to the following problems:
- free-text search is insufficient; and
- a pile of content makes a terrible database.
Taxonomies for Semantic Enrichment
The insufficiency of free-text search is traditionally mitigated by semantic enrichment (otherwise known as tagging or indexing) achieved by applying to the content terms from one or more taxonomies (or ontologies, or other knowledge organization systems). Taxonomic tagging allows us to sort and find documents by the concepts they are about rather than just the words that are in them.
(This is a technique fundamental to information science.)
The underlying challenge is that language is ambiguous. This manifests in two primary ways: synonymy and polysemy.
Synonymy
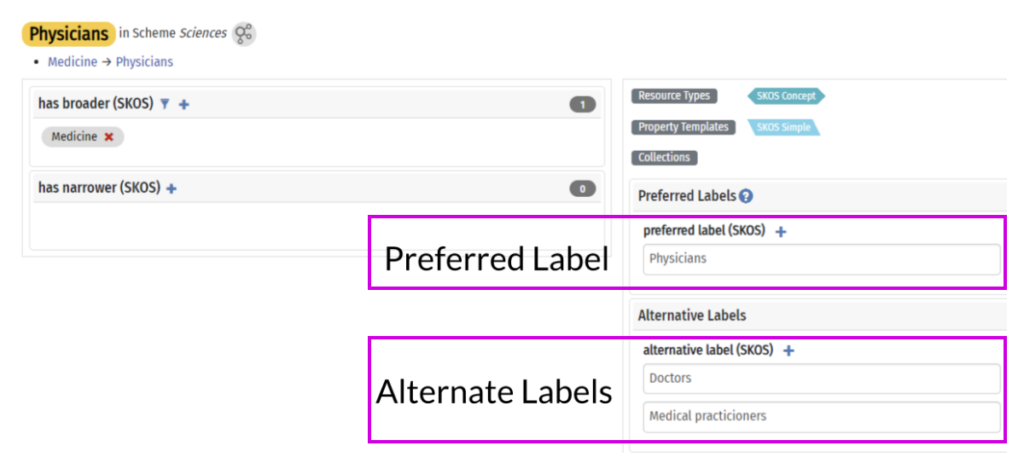
Synonymy describes synonyms: concepts that have more than one word with the same (or nearly the same) meaning. For example, if I search your huge pile of content for “doctor” and then, separately, for “physician” I am looking for the same content. If these two searches do not yield the same results, something is wrong—the search appliance does not understand that “doctor” and “physician” are two labels for the same concept.
That is to say: with free-text search I can get all the content with the word “doctor” in it, but that’s very different from all of the content about doctors (AKA physicians).
A taxonomy (technically, a thesaurus) can store these two labels and associate them with the same concept, so that a search for one is redirected to the other.

Polysemy
Polysemy is the inverse of synonymy: sometimes we use the same label (word or words) for different concepts. If I search your huge pile of content for “bank” I might find content about financial institutions, land near rivers, a pool shot involving bouncing a ball off a rail, and quite a few other concepts (including some verbs). A search for “Mercury” might return results about a planet, a car brand, a silvery metallic element, and perhaps a Roman god. But I’m an astronomer; I’m just interested in planets.
Again: with free-text search I get all the documents with the word “Mercury”, but that’s very different from all of the content about the Planet Mercury.
And again, a taxonomy solves this problem by differentiating these concepts so that documents can be tagged to support conceptual context (that is: not just the words in the document but rather the concepts they represent).
A taxonomy outlines the domain of important concepts and, when applied to content, greatly improves search and retrieval (among many other uses). This improves the big pile of content to Big Pile of Tagged Content, which is much better—but still not a database.
In a typical CMS, tags are associated with content but essentially disconnected from the taxonomy—they are merely words in a database field. They are also disconnected from any information stored in the taxonomic structure, like relationships to other terms, definitions, and other attributes. This limits the utility of the content for retrieval as well as analytics, personalization, and (I really don’t want to write about this) various inferential AI applications.
Towards Graphs
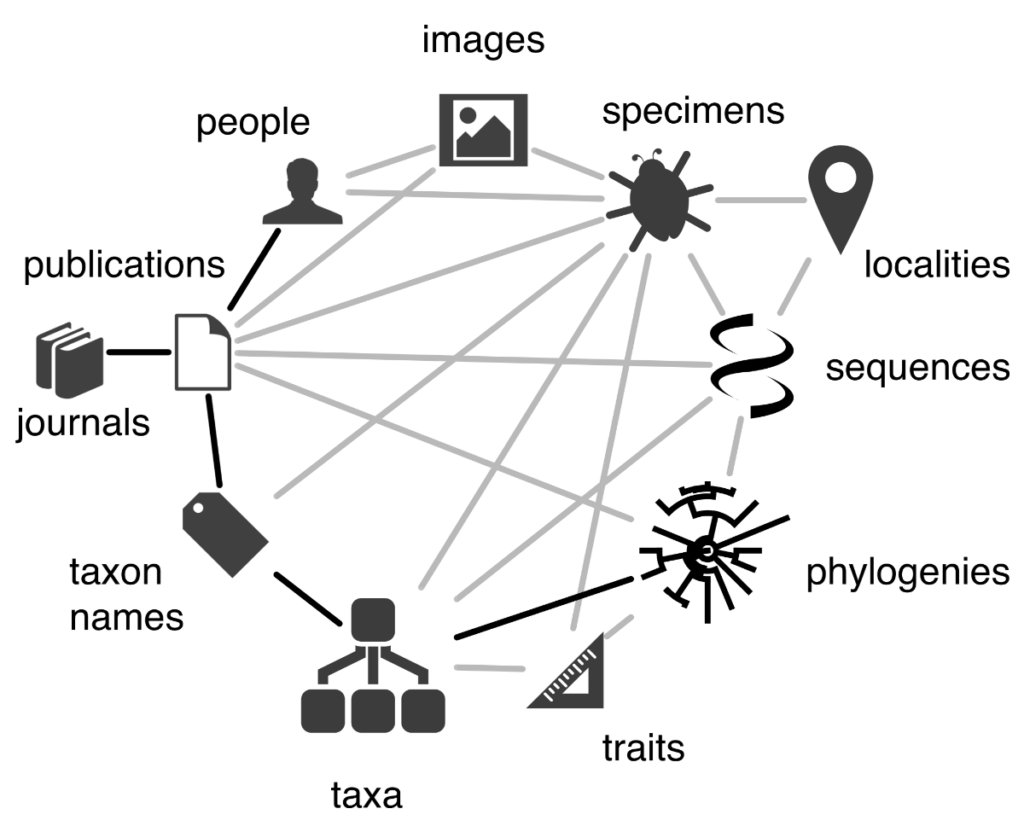
To get to the rich search results we’re looking for we need to understand content tags as objects, not just words in a field in a CMS (or, really, the relational database attached to one). We can extend this idea to, say, our content authors, their organizational affiliations, and any other data: data currently trapped in content form—which, again, is a terrible database.
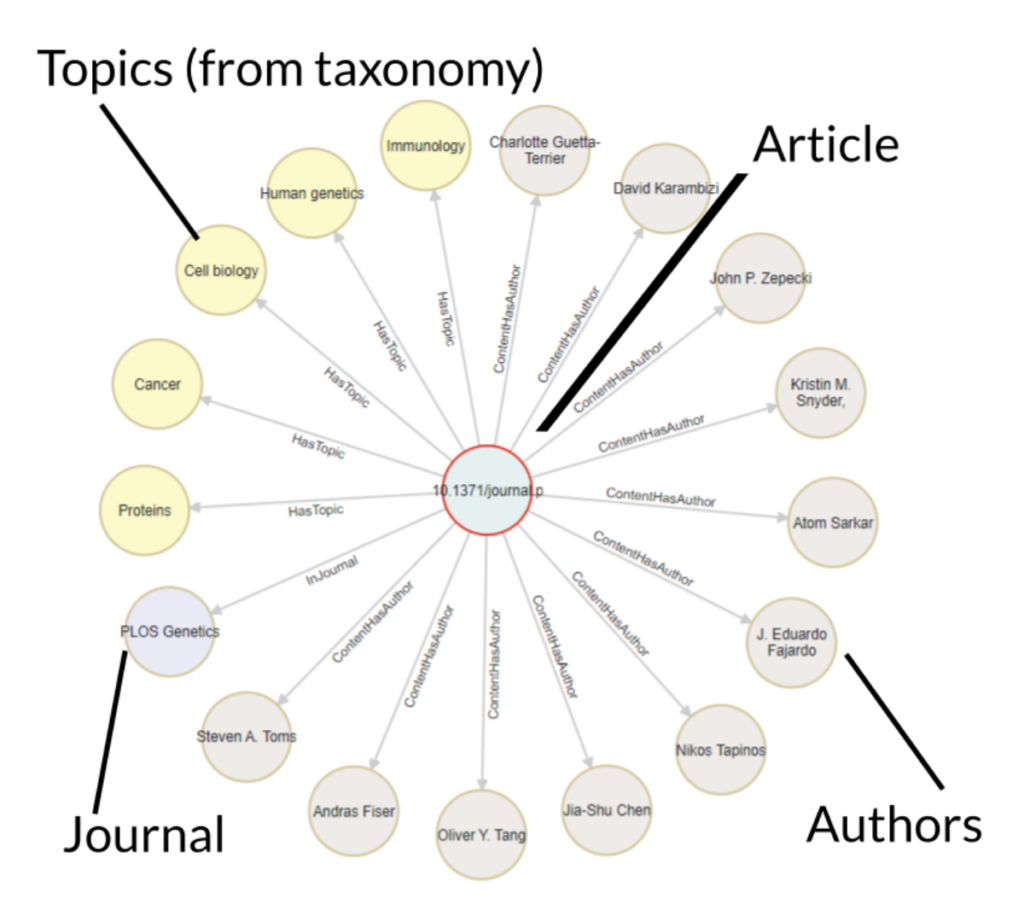
If we extract the author and subject (taxonomy tags) and other relevant data and model them as objects in the same information ecosystem, we can create a graph structure showing the relationships between them (which are, critically, also objects in the information ecosystem and not just intersections in a database table):

Now—with some user researchers, information architects, and a good interface designer—we can provide a better search experience. This could look something like the Google model (content plus subject information), but that’s only one option. We can allow the user to surf the graph starting with an article, a concept, an author, or any other information we find important to model–and from there browse around to find other topics of interest or filter results, for example.

This is as true for products (and product-based content) as it is for content alone. Graphs do not have a privileged direction; any point in the graph can be a point of entry–Dave Clarke of Synaptica describes this as being like a subway map: you can start at any point and get to anywhere you need to go.
Beyond Search: Personalization and Other Uses
One of the features of graphs (and ontologies, but that, again, is another (related) story) is that they are extensible. Once this infrastructure is in place, it’s simple to extend this logic to your users (logged-in users; let’s be ethical in our thought experiment): if users are represented as objects in the system we can establish relationships between them and the content (or products, whatever) and concepts they are interested in.
This can be done passively by relating them to things they look at, read, or buy; alternatively, you might allow users to subscribe to a concept or ”like” a topic or product or piece of content. Having such relationships modeled in your information ecosystem allows you to serve personalized content via recommendations, subscription, or other delivery models.
We can also now query this data—a graph database, it turns out, makes an excellent database—to do things like analytics on your content—or any other object in the system.
Towards a Content Graph
If this all seems theoretical and technical and modern: it is.
But this technology exists–it’s not imaginary or unattainable. It is not, however, as simple as plugging in some software; it requires that you have well-organized data and content first–a good information layer,
This means taxonomies and schemas and metadata, semantic and content models, systems integrations, and people to design and support and implement and govern them.
That is to say: transforming a huge pile of content into a content graph requires good information architecture.
